It usually starts with an innocent thought on a Friday evening.
You’re logged into a low-powered VPS or your homelab machine, and you notice your blog is feeling a bit sluggish. Or maybe you noticed a suspicious spike in inbound network bandwidth and you just want to know: Who is hammering my web server right now, what URLs are they hitting, and how badly is my upstream PHP-FPM or reverse proxy sweating?
Naturally, you look at your options in 2026:
- The “Modern Cloud-Native” Solution: Spin up Prometheus, Grafana, Loki, Node Exporter, and Promtail in four Docker containers. Congratulations: you are now burning 1.8 GB of RAM and 15% continuous CPU just to monitor a static blog that runs on a $5 DigitalOcean droplet.
- The SaaS Solution: Ship your access logs off to Datadog or an ELK SaaS. Enjoy the privilege of paying a $70/month telemetry bill for a website that generates zero revenue, while eagerly explaining GDPR data-processor agreements to your European visitors.
- The Traditional Route: GoAccess. Don’t get me wrong – GoAccess is an iconic piece of software, and I’ve used it for years. But if you want real-time sliding request rates, live connection status tracking, percentile latency distributions, and mobile notifications when your site starts returning 502s at 3 AM… you’re out of luck.
- The Caveman Route:
tail -f /var/log/nginx/access.log | grep -v 200. Works great until Matrix-speed walls of text blind you, or until log rotation breaks your tail command.
I didn’t want a 2GB container circus. I didn’t want to thrash my SSDs by writing hundreds of gigabytes of text logs just to parse them back off disk two milliseconds later. And I certainly didn’t want an enterprise telemetry contract.
I just wanted a single, razor-sharp binary that I could drop onto any Linux box, wire into Nginx in 30 seconds, and get gorgeous, real-time analytics without my server even noticing it was running.
Naturally, what started as “I’ll just write a quick little syslog parser in Go” escalated rather quickly.
Meet NginXplorer.
What Actually Is NginXplorer?
At its core, NginXplorer is an ultra-lightweight, zero-disk-overhead telemetry engine, real-time web dashboard, and CLI terminal UI for Nginx.
It compiles down to a single, static Go binary (~12MB). When running, it sips a modest 15–25 MB of RAM and hovers around 0% CPU under normal traffic.
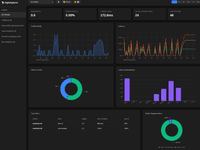
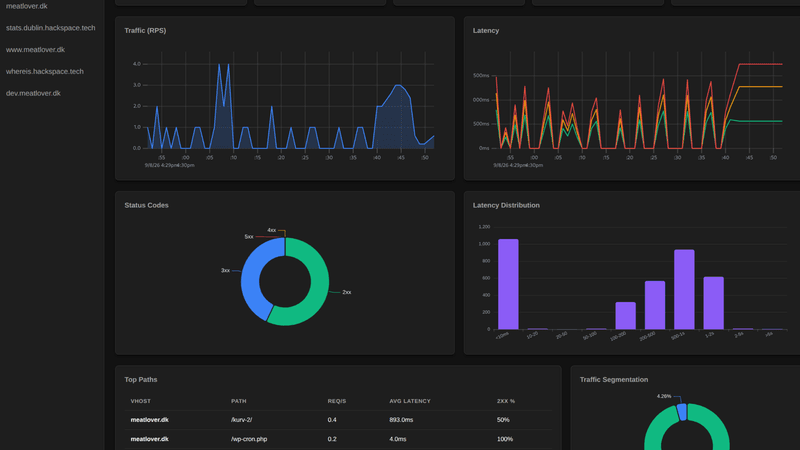
Yet it gives you instant sliding-window metrics, response time percentiles (p50, p90, p99), latency distribution histograms, traffic segmentation (Human vs. Good Bot vs. Hostile Scanner), multi-channel alerting, and a real-time web dashboard powered by Server-Sent Events (SSE).
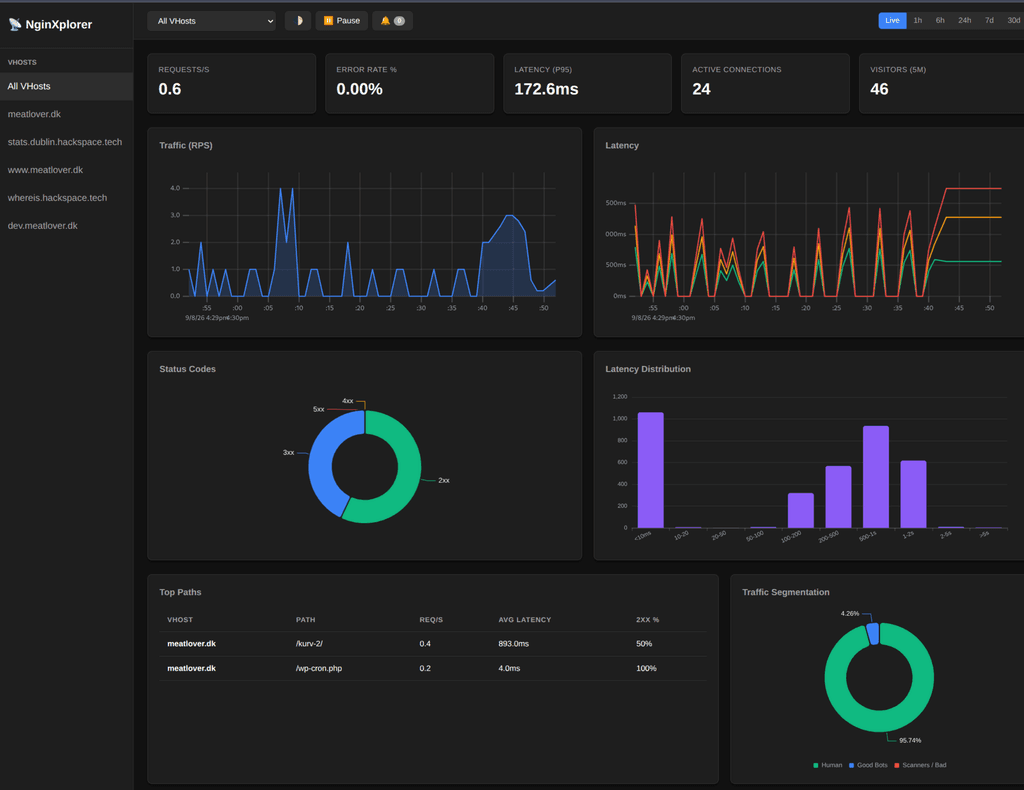
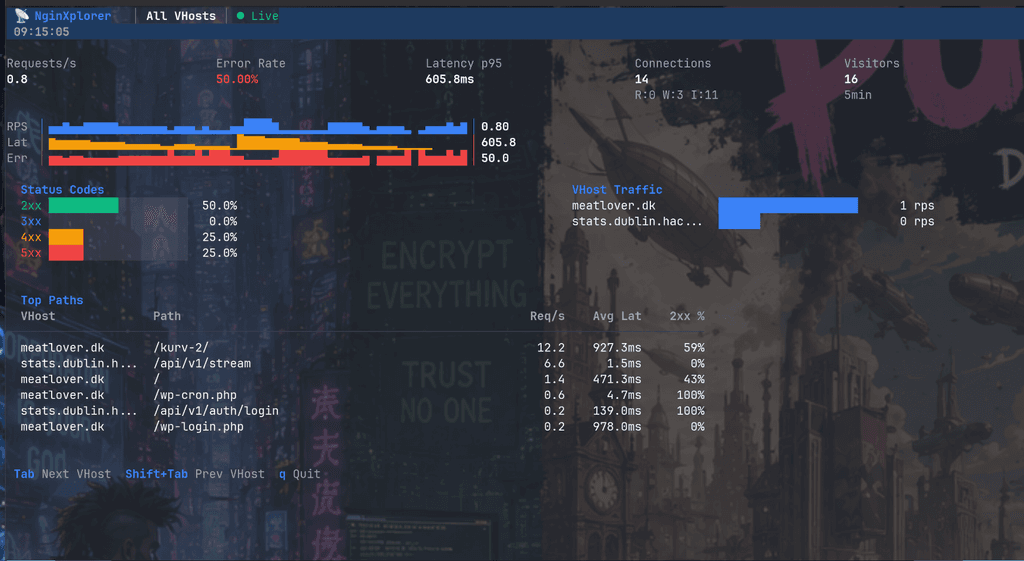
Oh, and if you’re trapped inside an SSH session without a browser? It has an interactive terminal UI built right into the same binary.
The Secret Sauce: Zero Disk I/O via Unix Domain Sockets
Most log analyzers operate on the Disk-Bound Conveyor Belt:
- Nginx formats an access log entry as a string.
- Nginx calls
write()to append it to/var/log/nginx/access.log. - The kernel flushes dirty pages to your NVMe/SSD.
- An external agent (
promtail,fluentd,goaccess) callsread()to pull the line back from disk. - The agent parses the string with a heavy regex engine.
If you’re taking 2,000 requests per second, your storage subsystem is getting pounded for no reason whatsoever.
NginXplorer bypasses the filesystem entirely using local Unix Domain Socket syslog streaming.
Nginx has supported native syslog logging since version 1.7.1. All you do is tell Nginx:
# /etc/nginx/conf.d/nginxplorer.conf
log_format nginxplorer_json escape=json
  '{"time_local":"$time_iso8601","remote_addr":"$remote_addr",'
  '"request_method":"$request_method","request_uri":"$request_uri",'
  '"status":$status,"body_bytes_sent":$body_bytes_sent,'
  '"request_time":$request_time,"http_referrer":"$http_referer",'
  '"http_user_agent":"$http_user_agent","host":"$host"}';
access_log syslog:server=unix:/var/run/nginxplorer.sock,nohostname nginxplorer_json;Nginx fires structured JSON directly across kernel memory through a Unix socket directly into NginXplorer’s ingest buffer.
- Zero disk writes: Your SSDs will thank you.
- Zero regex: JSON is unmarshaled into native Go structs immediately.
- Microsecond latency: Events hit the aggregation pipeline instantly without polling lag.
- Non-blocking: If NginXplorer is stopped or restarted, Nginx doesn’t hang – syslog over datagram sockets simply drops unread frames without impacting web traffic.
Why Use This Instead of [X]?
Whenever you publish a developer tool, the immediate reaction on Hacker News is always: “Why didn’t you just use X?” So let’s break down how NginXplorer stacks up against the usual suspects:
| Feature / Metric | NginXplorer | GoAccess | Prometheus + Grafana + Exporters | ELK / Datadog |
|---|---|---|---|---|
| Deployment Footprint | 1 static binary (~12MB) | 1 binary (needs C deps) | 3–5 containers + configs | Enormous container stack / SaaS agent |
| Memory Footprint | ~20 MB | ~50–150 MB | 1.5 GB – 3 GB+ | Multi-gigabyte JVM / SaaS overhead |
| Disk I/O | Zero (Unix domain socket) | Heavy (tails access log) | High (logs + TSDB write-ahead) | Very Heavy |
| Setup Time | 1 minute | 5 minutes | Half a weekend and a pint of tears | Days / Credit card entry |
| Latency Distribution | Real-time 10-bucket histogram | Averages / basic percentiles | Requires complex PromQL histograms | Yes, but expensive |
| Sliding Window RPS | 1m / 5m / 15m live sliding | Static total / daily buckets | Yes (PromQL rate()) | Yes |
| Active Connections | Yes (stub_status poller) | No (logs only) | Yes (via nginx-exporter) | Yes |
| Traffic Classification | Human vs. Search Bot vs. Scanner | Basic user-agent listing | Manual label regexes | Custom log pipelines |
| Terminal UI (TUI) | Yes (Interactive Bubble Tea) | Yes (ncurses) | No | No |
| Alerting | Built-in (ntfy, Pushbullet, Slack) | None (needs external cron) | Requires Alertmanager | Built-in ($$$) |
| Mobile UX | Full PWA with install prompt | Zoomed-in desktop HTML | Grafana App | Vendor App |
The Feature Tour (Or: The Stuff I Kept Adding at 2 AM)
1. Real-Time Latency Histograms
Average response time is a lie. If 99 requests take 5ms and 1 request takes 10 seconds, your average looks fine, but your user is staring at a white screen.
NginXplorer tracks upstream and request timing using an in-memory sliding histogram categorized into 10 intuitive response buckets:
< 10ms(Cached / static assets)10–50ms,50–100ms,100–250ms,250–500ms(Fast to acceptable backend response)500ms–1s,1s–2.5s,2.5s–5s,> 5s(The “fix your slow database query” zone)
You can literally see your tail latencies pop up in real-time as a database query chokes.
2. Bot & Scanner Segmentation
If you host a server exposed to the public internet, you already know that 60% of your traffic isn’t real people: it’s Shodan, Censys, Chinese vulnerability scanners looking for .env files, and Russian script kiddies probing for /wp-login.php on a site that doesn’t even run PHP.
NginXplorer separates your traffic into three distinct streams:
- Humans: Real browsers with valid referrers and human session behavior.
- Good Bots: Googlebot, Bingbot, DuckDuckGo, Pingdom, etc.
- Threats & Scanners: Automated scanners, CVE fuzzers, and headless scrape scripts.
You can toggle between them with a click. Want to see what your actual human audience is reading without the noise of 40,000 automated WordPress probes? Just deselect Scanners.
3. Native Push Alerting (Zero Extra Daemons)
You shouldn’t need to set up Prometheus Alertmanager just to get a ping when your server starts 500’ing. NginXplorer includes a background alert evaluator with multi-channel dispatchers:
- ntfy.sh (Instant, registration-free, end-to-end encrypted mobile push)
- Pushbullet
- Slack & Discord Webhooks
Configure threshold triggers for 5xx error spikes, traffic drops, or sustained high latency, and get a notification on your phone before your users start tweeting at you.
4. Interactive Terminal UI (TUI)
Sometimes you are stuck in an SSH session on your phone or on an airplane terminal with flaky WiFi, and spinning up a local port forward for a web browser is a pain.
Running nginxplorer --tui launches a full, keyboard-navigable terminal interface written with Charm’s glorious Bubble Tea framework. It gives you live updating request counters, error rates, and top URI/IP leaderboards directly inside your shell. You can even have it installed locally and then point it to your remote nginx installation with nginxplorer integrated.
5. Installable PWA with Dark/Light Mode
The web interface isn’t an afterthought. It’s a responsive Single Page App with a complete Web App Manifest and Service Worker. Visit your dashboard on an iPhone or Android device, tap “Add to Home Screen” (the app will even politely ask if you’d like to install it), and you have a native-feeling monitoring app on your pocket device with zero app-store nonsense.
And yes, because I have standards: it has full, automatic dark mode support that respects your system preferences.
60-Second Quickstart
Convinced? Let’s get it running.
Grab the latest binary from GitHub (or install the deb/rpm):
# Download the latest release for your architecture
curl -s https://api.github.com/repos/kimusan/nginxplorer/releases/latest \
| grep "browser_download_url.*linux_amd64.tar.gz" \
| cut -d : -f 2,3 \
| tr -d \" \
| wget -qi -
tar -xzf nginxplorer_*_linux_amd64.tar.gzsudo mv nginxplorer /usr/local/bin/Generate a default configuration:
nginxplorer init-config > config.yamlWire Nginx to stream logs to NginXplorer’s Unix socket:
# Add to your nginx.conf http {} block:
log_format nginxplorer_json escape=json  '{"time_local":"$time_iso8601","remote_addr":"$remote_addr",'  '"request_method":"$request_method","request_uri":"$request_uri",'  '"status":$status,"body_bytes_sent":$body_bytes_sent,'  '"request_time":$request_time,"http_referrer":"$http_referer",'  '"http_user_agent":"$http_user_agent","host":"$host"}';

access_log syslog:server=unix:/var/run/nginxplorer.sock,nohostname nginxplorer_json;Reload Nginx and run NginXplorer:
sudo nginx -s reload
nginxplorer run --config config.yamlOpen http://localhost:9100 in your browser. That’s it. No Docker, no databases, no Java virtual machines, no NPM dependencies. Just clean, instantaneous telemetry.
Running It as a Proper Systemd Service (Set and Forget)
Running binaries manually in a tmux or screen session is fine for testing, but let’s be civilised adults and hand it over to systemd.
Drop your config into /etc/nginxplorer/config.yaml, then slap together a clean, locked-down unit file at /etc/systemd/system/nginxplorer.service:
[Unit]
Description=NginXplorer - Real-time Nginx Observability
After=network.target nginx.service
Wants=nginx.service
[Service]
Type=simple
User=root
Group=root
ExecStart=/usr/local/bin/nginxplorer run --config /etc/nginxplorer/config.yaml
Restart=on-failure
RestartSec=5s
LimitNOFILE=65535
# Linux sandbox hardening (because why give it privileges it doesn't need?)
ProtectSystem=full
ProtectHome=true
PrivateTmp=true
[Install]
WantedBy=multi-user.targetReload systemd, enable it on boot, and kick it into gear:
sudo systemctl daemon-reload
sudo systemctl enable --now nginxplorerA quick systemctl status nginxplorer will confirm it’s happily listening on 127.0.0.1:9100 and awaiting Nginx syslog datagrams. No memory leaks, no runaway workers, no log rotation scripts to babysit. It just runs.
Wrapping Up
Software development in the 2020s has a weird obsession with complexity. We’ve normalized needing a Kubernetes cluster and four separate microservices just to count HTTP status codes.
NginXplorer is my modest counter-offensive against that trend: a high-performance, single-purpose, beautiful tool that solves a real problem cleanly and gets out of your way.
The project is fully open-source under the MIT license on GitHub:
github.com/kimusan/nginxplorer
Give it a spin on your servers, star the repo if you find it useful, and if you find a bug or have an idea for a feature that doesn’t add 50 megabytes of bloat, feel free to open an issue or PR!