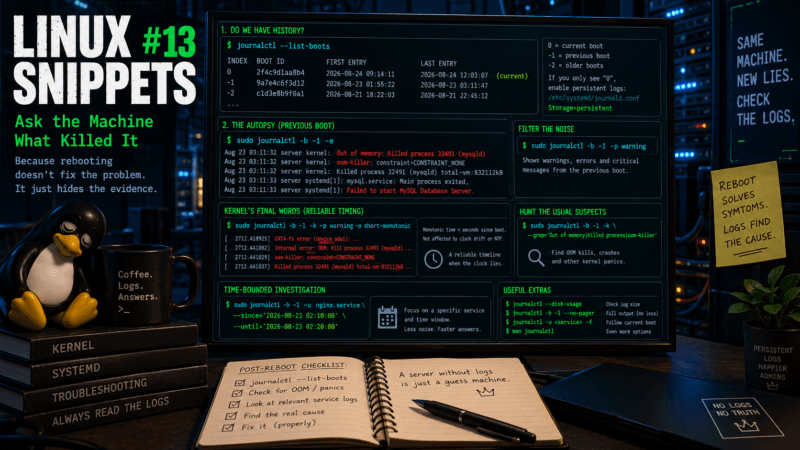
Introducing the “Sovereign Snippets” Series: Most of our time is spent in complex configurations, but the real power of a Linux system often hides in the short, punchy commands we use every day to maintain control over our hardware. I’m starting this series to document the specific “one-liners” I use to audit, secure, and manage my systems. No fluff – just functional tools for those who prefer the CLI over a GUI.
The Amnesia of the Reboot
You get a monitoring alert at 3:15 AM. The server is completely unresponsive. You log into your hypervisor or cloud console and force a hard reset. Five minutes later, the machine comes back online. You SSH in, run htop, and everything looks pristine. The load average is 0.01, RAM usage is nominal, and the services are happily serving traffic.
A crashed server often returns from a reboot looking suspiciously innocent. If you just shrug and close your laptop, you haven’t fixed the problem; you’ve just reset the timer on a ticking time bomb.
You need to perform an autopsy. You need to ask systemd what exactly was happening in the final moments before the lights went out.
Step 1: Does the Machine Remember?
Before you can investigate the previous boot, you must ensure your server actually keeps persistent records. Many minimal container images and lightweight distros configure journald to write logs purely to volatile RAM to save disk I/O.
First, check if your system retains historical boots:
journalctl --list-boots(You should see a numbered list. 0 is your current boot, -1 is the previous boot, -2 is the one before that, and so on. If you only see 0, you need to create the directory /var/log/journal/ and ensure Storage=persistent is set in /etc/systemd/journald.conf).
Step 2: The Autopsy
Assuming you have a persistent journal, you can jump directly to the end of the previous boot (the moment right before the crash) using the -b -1 and -e flags:
sudo journalctl -b -1 -eFiltering the Noise
Looking at the raw end of a boot can be overwhelming, as every failing service screams at once. Let’s isolate the severe issues. We can restrict the output to warnings, errors, and critical failures:
sudo journalctl \
  -b -1 \
  -p warning \
--no-pager(Note: The -p warning flag doesn’t mean “warnings only.” It means “warning priority and everything more severe.”)
The Kernel’s Final Words
If the crash was hardware-related or caused by extreme resource starvation, user-space applications often won’t have time to log an error. You need to look directly at the kernel.
We apply the -k flag to filter only kernel messages, and crucially, we use -o short-monotonic:
sudo journalctl \
  -b -1 \
  -k \
  -p warning \
-o short-monotonicWhy monotonic time? During a severe crash, hardware clocks can drift, and NTP services might fail or attempt aggressive corrections. Standard wall-clock timestamps can become highly misleading if the clock jumped backward right before the system died. Monotonic time displays timestamps strictly as seconds elapsed since the machine was powered on, giving you a mathematically reliable sequence of events.
Step 3: Hunting the Usual Suspects
Eighty percent of mysterious late-night crashes are caused by the kernel executing the Out-Of-Memory (OOM) killer to protect itself from a runaway process. You can search the previous boot specifically for this massacre:
sudo journalctl \
  -b -1 \
  -k \
--grep='Out of memory|Killed process|oom-killer'(If you are running an ancient version of systemd that doesn’t support the --grep flag, just pipe the bounded result through native grep: sudo journalctl -b -1 -k | grep -Ei 'out of memory|killed process|oom-killer').
Step 4: The Time-Bounded Investigation
Sometimes you already know exactly when the incident occurred, and you suspect a specific service caused it. To prevent three months of routine PHP or Nginx complaints from cluttering your investigation, you should define a strict time window and target a specific unit.
sudo journalctl \
  -b -1 \
  -u nginx.service \
  --since='2026-08-23 02:10:00' \
--until='2026-08-23 02:20:00'Replace the dates and unit name with your actual crime scene.
The Caveats (The Tax on Logging)
- Finite Evidence: Journal retention is finite. You can check how much disk space your logs are consuming with
journalctl --disk-usage. A forensic record that was aggressively vacuumed yesterday to save disk space remains admirably storage-efficient and diagnostically useless. - Sensitive Autopsies: Journal entries are raw memory dumps of failing processes. They can contain usernames, executed command lines, internal IP addresses, and sensitive application data. Treat exported logs as hazardous material. Don’t blindly paste the output of a crash into a public GitHub issue without sanitizing it first.
Over to you: What is the most obscure failure you’ve managed to track down using journalctl -b -1? Or do you still prefer digging through compressed plaintext files in /var/log/?